P&L Grow systems - The Minder Unit - Thermohygrometer Logger
In stock
Order in the next 00 hours, 00 minutes, 00 seconds for dispatch today.
- IoT based humidity and temperature logger
- Check your room’s variables anytime, anywhere
- Data is accessible through any internet connected device
- Clear and easy to read charts – switch between dials and graphs
- Automatically Calculates VPD
- User-set alerts
- Help take your game to the next level through consistent results
- Know more, Grow more – Data driven decisions
Know more, grow more – Data driven decisions
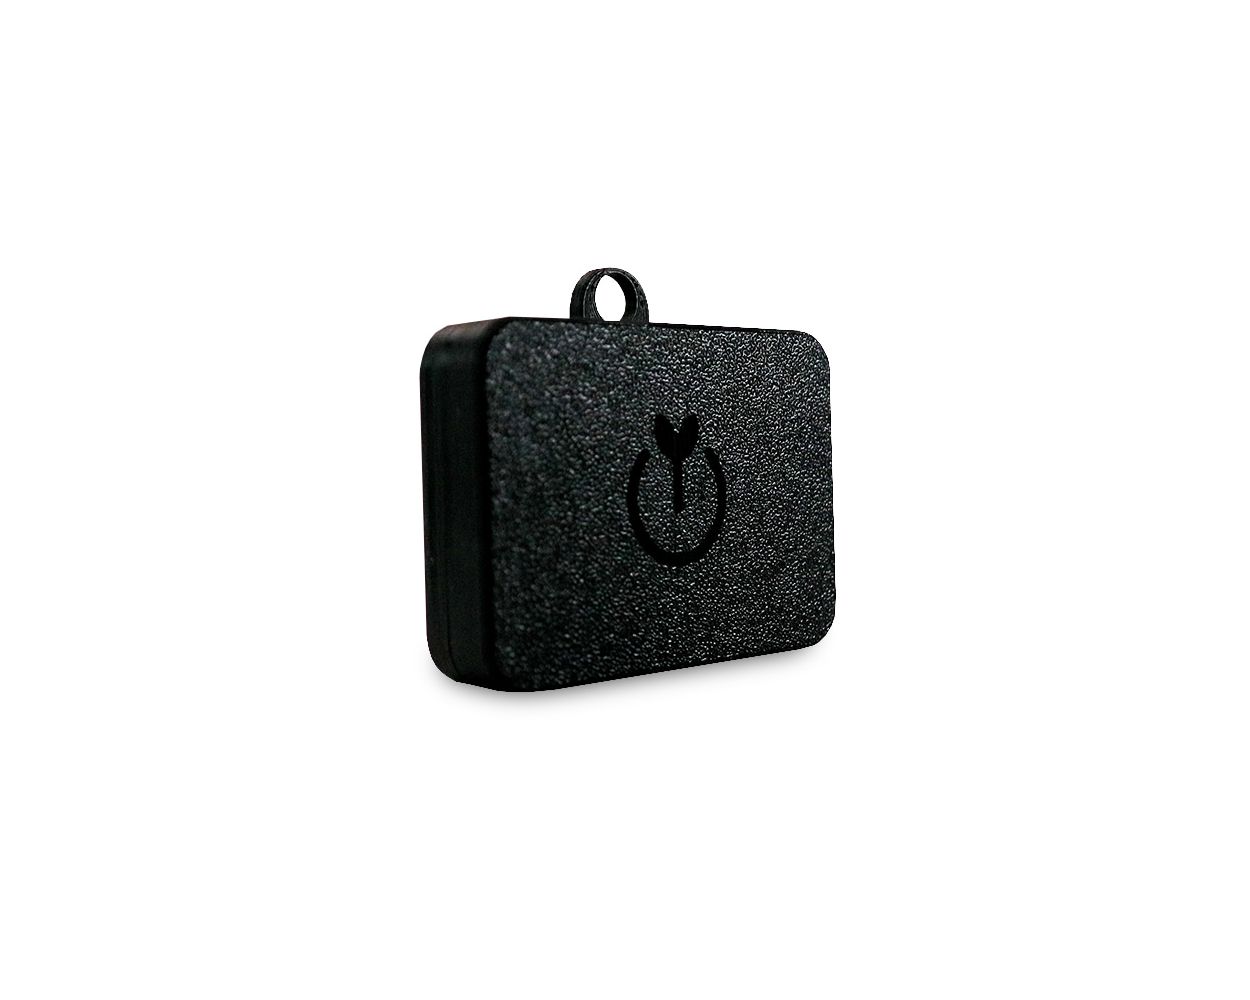
#theMinder is a small device designed to help you track and manage any environment remotely from anywhere in the world. #theMinder connects to the cloud-based user interface to monitor and log environmental data and can be set up to alert you if parameters are exceeded. The Interface is browser-based and accessible from anywhere in the world with an internet connection, including mobile phones, so you can check your parameters anywhere, anytime.
#theMinder unit will monitor ambient air temperature and relative humidity as well as calculating VPD values. Also included is a second waterproof temperature probe that can be used in growing media to monitor root zone temperature, placed in feeding solution tanks to monitor solution temperature, or used to monitor air temperature in another part of the growing environment.
All existing and future versions can be added to your user account as the need arises and will be compatible with future releases from P&L.
The cleverly designed user interface can be accessed from any device that has internet connectivity from any location in the world. From here you can see all your connected #theMinder units for each environment being monitored. Access all your data and display it on dynamic graphs that gives you real insight into how your environment behaves over time.
You can also export your data for offline analysis and report creation. All of the functions of each #theMinder units can be accessed and setup to suit your needs via the interface including renaming, high/low setpoints, area assignment, alert parameters and display configurations.
With #theMinder you can have peace of mind about your environment no matter where you are, no longer do you have to worry and stress if everything is ok when you are not there.
Once you harvest your crop, #theMinder can be used to monitor the equally important drying and curing stages and the final storage of the crop.
#theMinder is not just for grow environments. The technology can be applied to a whole host of areas where environmental data needs to be monitored and collected such as air quality monitoring, animal husbandry, domestic environments, commercial environments and industrial processes.
Consistent environment for more reliable results
For a large range of plant species, the environment is one of the largest factors to influence the quality and quantity of your yield; by having the ‘perfect’ environment for a given species, you allow it to reach its full genetic potential. Consistent environments also allow the grower to ‘dial in’ the crop, where you get the best out of the particular cultivar you’re working with through a process of trial and error and keeping routines that work well with particular varieitie. In a stable environment, you make sure it is the variable you’re changing that will have an effect on the outcome, so you can be much more certain of any testing you carry out.
An increasing number of professional growers are using VPD charts as guides for humidity in the grow room to push their results to the next level. The VPD calculation considers the pressure at the leaf surface as well as the pressure in the room, so the grower can maintain the perfect offset pressure between the plant and room to match the stage of growth the plant is in.
Better Yields & Returns
- Fine tune your environment to maximise output
- Avoid issues – The minder gives early alerts so there’s plenty of time to react
- Get insights into your environment like never before
- KNOW MORE, GROW MORE
Quick and Easy
- Less than 10 min to be up and running
- 3 Step process
- Browser based - No app download or installs required
- Data updated every 30 seconds
- Easy to read data display
Features
- 1 Ambient temperature and humidity sensor
- 1 Waterproof temperature sensor
- Temperature, Humidity and calculated VPD data
- Data updated every 30 seconds
- 4 weeks of rolling historical data
- Custom Alerts
WiFi Network requirements
theMinder unit is an Internet of Things (IoT) device and as such requires an always on internet enabled WiFi network to operate. A mobile hotspot access point or mobile phone running as an access point works great if no broadband router WiFi is available.
- 2.5GHz WiFi network
- Always on internet enabled network
Dashboard Config
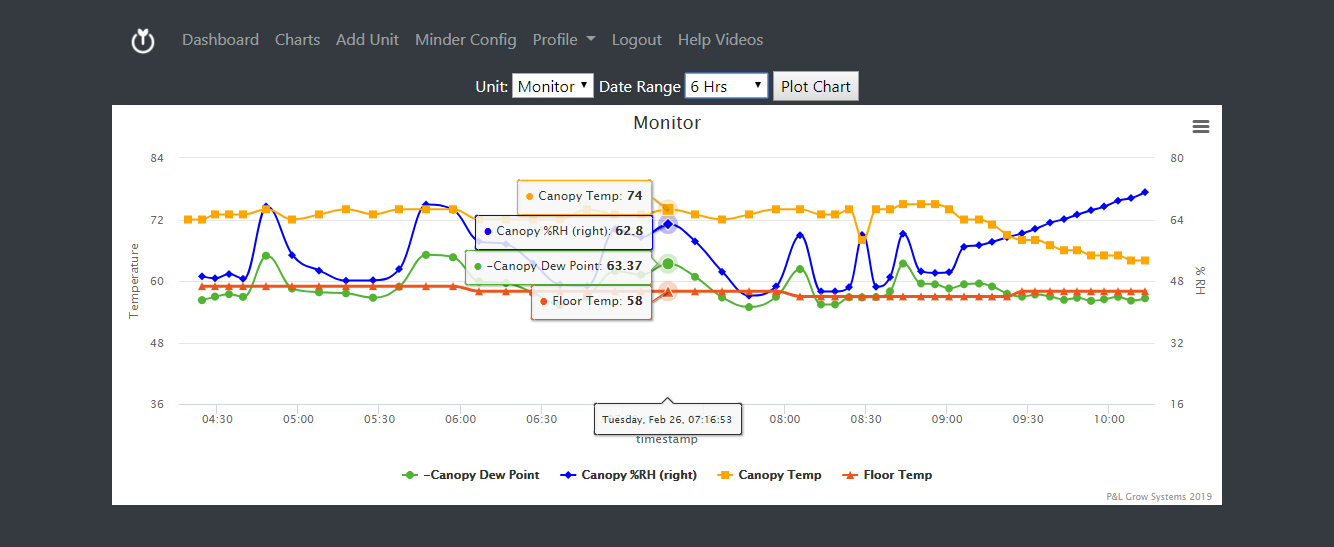
The Dashboard displays as dials or graphs, allowing the user to quickly see if variables are within optimal limits - on the graph view, you can set the date & time range to get a better resolution and determine any events that have occurred in the space over a large time range – perfect for analyzing environment since your last visit.
There are 4 lines on each graph:
1. Dew point: This variable is automatically calculated and represents when humidity in the air will condense onto cool surfaces. If your canopy temperature goes below the dew point in bloom, problems associated with rot increase significantly.
2. Canopy Relative Humidity: Place at the canopy level to get an idea of the humidity around plant leaves. The onboard computer uses the humidity and temperature data to work out the room’s VPD.
3. Canopy Temperature: Measures temperature at the canopy to get an accurate value for VPD. Maintain a consistent temperature of around 25 degrees C during lights on. Canopy temps should never drop more than 5 degrees C than your lights on temperature for best results.
4. Floor/substrate/water Temp: With the Waterproof temperature sensor, you can place it on your floor in your pot or in your reservoir to monitor the temperature. This is particularly useful for non-insulated floors such as concrete cellars as the ambient floor temp can often be significantly lower that ambient air temperature, which can shock roots and slow down plant growth.
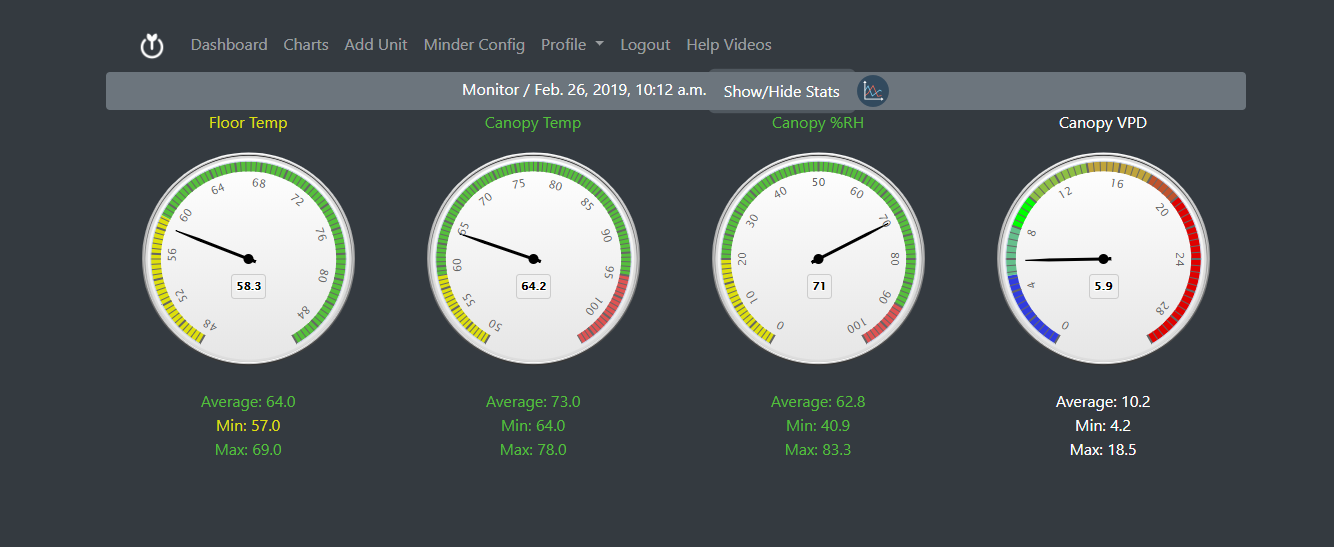
When the Dashboard is displayed as dials, it automatically displays the current readings. You can easily look through historical data by changing the time at the top, but most customers prefer to use the graph when analyzing larger datasets. The dials are great if you just want to check everything is within optimal levels.
P&L Grow Systems Minder kit contains:
- #theMinder device
- 2 x 2.5m sensor leads with sensors
- 1 x Waterproof temperature sensor
- 1 x Ambient temperature and humidity sensor
Power requirements - Optional if you wish to include a power supply
To encourage people to recycle their existing electronics we do not include a power supply as standard. We specifically selected Micro USB as it is the most common connector type.
5V 1.5A (2A recommended) Micro USB power supply
How to use P&L Grow Systems Minder kit
Simply plug the unit into a micro USB and place the probes in appropriate locations; the 2-in-1 humidity and temperature probe are best placed at the canopy level while the waterproof temperature probe can be placed in your substrate, medium, reservoir or on the floor.
Either sign up or log-in to the P&L portal
You can then configure the p&L app with your grow room’s variables such as volume, amount and power of light fixtures. Multiple rooms can be configured from the dashboard and you can have several P&L Minders in each environment.
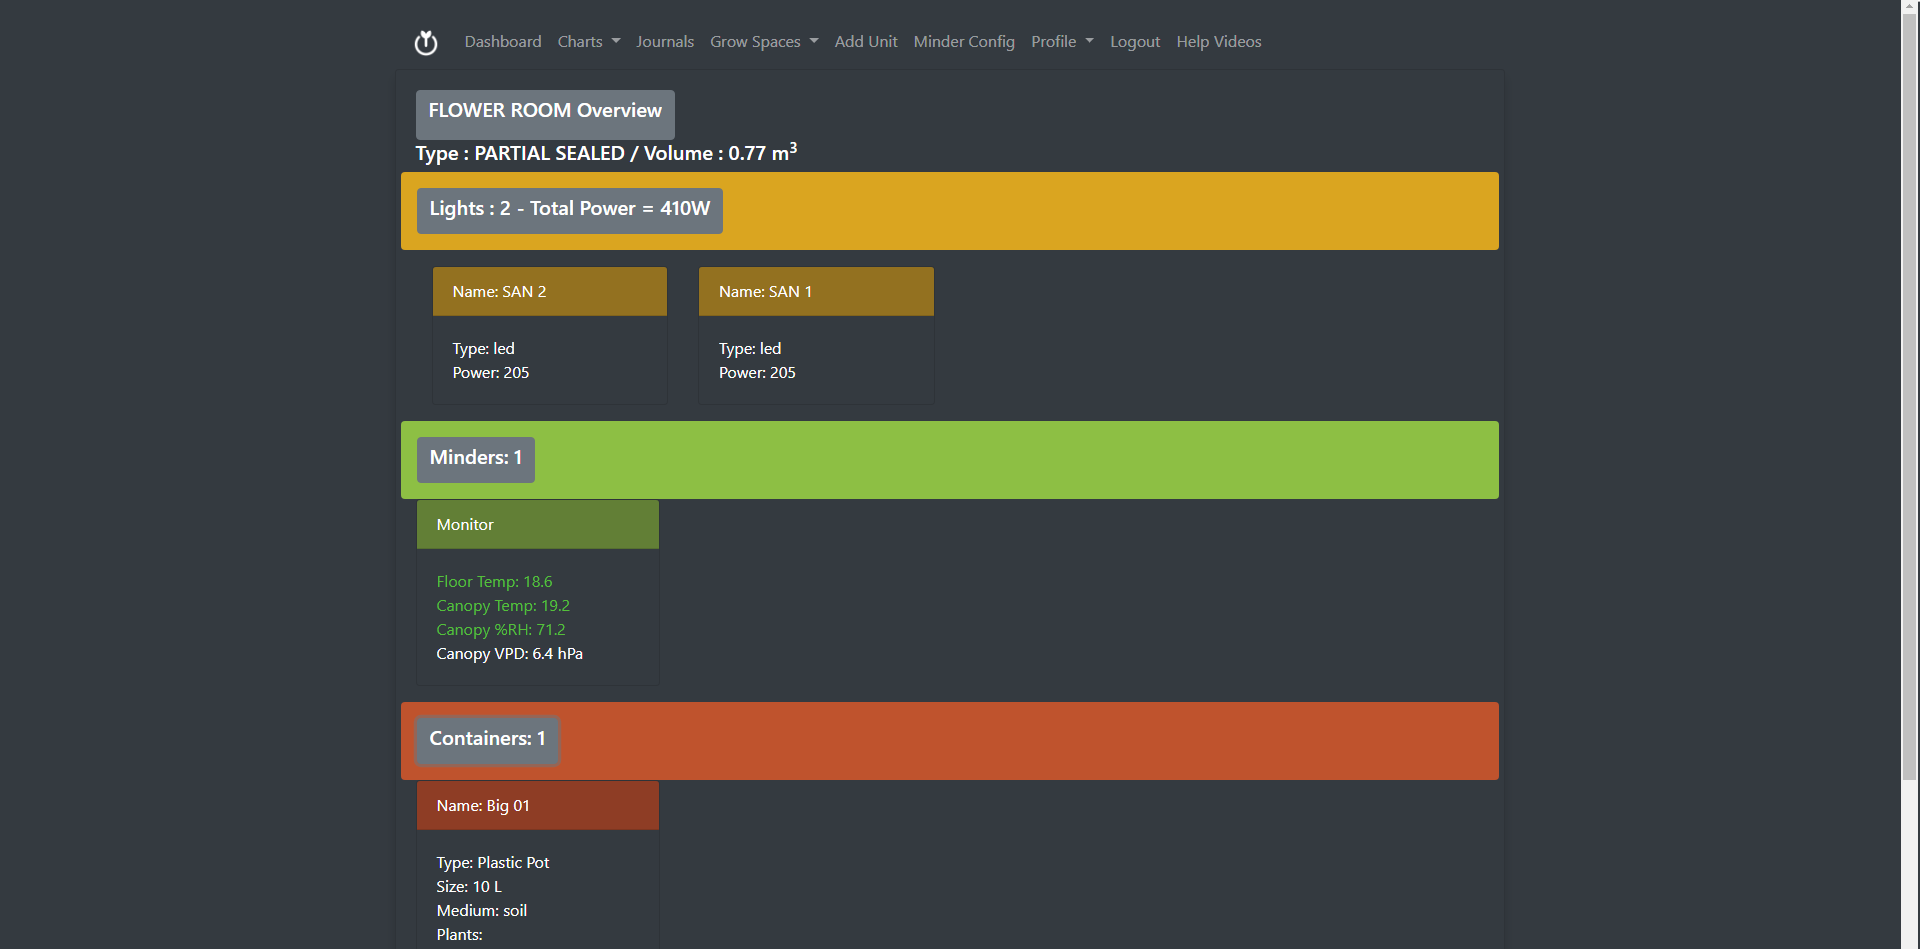
Once each P&L Minder is configured to your rooms, with a simple click of a button, you can change the view from dials to a graphs and change the time range so you can best analyze the readings and make changes to your grow room equipment to better maintain optimal environmental ranges.

Our UK Mainland delivery service is provided by Parcelforce Worldwide.
NOTE: For anyone outside of the UK (i.e. Republic of Ireland and the EU) you are free to arrange your own courier service. To order from us using your own courier, complete your purchase from our website, and select "Collect from our Warehouse — Chigwell". This is where you can arrange your own courier to collect your item(s) from. Address details are available on the Contacts page.
Standard UK mainland orders over £50.00 are eligible for a free standard next working day delivery service (Mon – Fri)*.
- *Free delivery includes orders up to, and not exceeding, 30kg, that fit in a single, standard shipping box.
- *Free delivery may exclude orders containing one or more large volume items. Examples of large volume items are, but are not limited to, bags of media (clay balls, perlite, soil etc.).
- *Free delivery excludes Garden Power Tools.
- *Large items are sent via a standard 48L (48 hour large) service. Large items take from 2 working days to arrive.
Where possible, orders received by 2:30pm Mon – Fri are dispatched the same day. (*Excluding Garden Power Tools).
Where possible, Garden Power Tool orders are dispatched the same day when received by 11:00am Mon – Fri. Orders after 11:00am are usually dispatched the next working day
UK mainland orders after 2:30pm Mon - Fri are subject to next working day dispatch:
- For example, orders after 2:30pm on a Friday are dispatched on the next working day, usually a Monday.
UK Mainland Pallet deliveries are charged separately per pallet. They are usually delivered in 2-3 working days. Please contact us for the latest cost price.
Our shipping providers terms and conditions limit our ability to send some products internationally. See our list of restricted items.
All prices shown below are per parcel with a maximum weight of 30 kg per parcel. Items over 30 kg are split into multiple boxes and charged per box.
Future Garden are not liable for any additional fees that may be incurred. Any unexpected costs must be paid by you (the customer).
Delivery services provided online are estimates. There may be unforeseen delays with your order, especially around our busiest time of year. Very busy periods can see very high volumes of parcels being collected, processed and delivered. If you have a special delivery requirement, please contact us via email - info@futuregarden.co.uk before placing your order.
UK Mainland
| Standard Next Working Day (Orders over £50 <30 kg) | FREE |
| Standard Next Working Day (Orders under £50 max. 30 kg per parcel)* | £6.95 |
| Standard 2-3 Working Day (Orders under £50 max. 30 kg per parcel)* | £4.95 |
| Pallet Delivery | £70.00 |
Isle of Wight
| Next Day Service | £8.95 |
Northern Ireland
| Two Day Service | £18.95 |
Isle of Man & Scilly Isles
| Two Day Service | £20.95 |
Scottish Highlands & Islands
| Two Day Service | £16.95 |
International
Sorry, no online quotes are available for orders outside of Europe. If you would like to place an order for delivery outside of Europe, email us directly and we can prepare a bespoke quote for you based on the weight, dimensions and destination country for the most accurate cost and quickest delivery times to you.
As per the Consumer Contract Regulations June 2014, you can return goods and receive a full refund under the following conditions:
- You have had the goods delivered within seven working days of delivery from Future Garden Ltd, this starts from the day after the goods have been signed for.
- The items are unopened and in the original condition as when they were delivered to you.
or
- The items have developed a fault during standard use.
- The items are within the manufacturer's warranty period.
Simple checks
- Please ensure that any parcels delivered are intact and free from damage and unopened, if they appear to show any damage please make a note when signing for the goods, alternatively you can refuse delivery of these items, however only full refusal if multiple parcels will be accepted, in the unlikely event this occurs please contact us asap on 020 8502 7722 or by email info@futuregarden.co.uk.
- Please check all items once unboxed to ensure that they are not damaged and are fully functioning, if this is not the case please ensure you notify us as soon as you can, or within the given returns policy time frame, on 020 8502 7722 or by email info@futuregarden.co.uk we will then arrange suitable collection and replacements where necessary.
- If any items appear not to be functioning as expected, do not attempt to fix or tamper with any products, this could affect your statutory rights, please notify us on 020 8502 7722 or by email info@futuregarden.co.uk and we will arrange a suitable replacement.
- If you notice any irregularities with your order, please notify us as soon as possible or within 7 working days, on 020 8502 7722 or by email info@futuregarden.co.ukwe will endeavour to correct and refund where possible.
- You can return any unwanted items, you can return the item(s) to us unopened and intact in a re-sellable condition within 14 working days after the day of receiving the goods, we are unable to accept any goods back that have been opened or the seal(s) have been broken or have been damaged, unless reported as damaged in transit, you can contact us on 020 8502 7722 or by email info@futuregarden.co.uk
-
![Pure Factory Humidifiers]() Pure Factory HumidifiersAs low as £45.60
Pure Factory HumidifiersAs low as £45.60 -
![Lighthouse Oil Filled Radiator]() Lighthouse Oil Filled RadiatorAs low as £44.45
Lighthouse Oil Filled RadiatorAs low as £44.45